For teams running more than one Ceph cluster
Every Ceph cluster on one map
Why one cluster at a time stops working
- 01
No global view
Several clusters at several sites, and no single place that answers whether the whole estate is OK. Metrics dashboards show KPIs, not the logs, configuration and disk health an admin needs when one of them is not.
- 02
Login fatigue
With twenty clusters nobody wants twenty interfaces open to compare one setting or chase one alert. The tab with the problem is never the one in front.
- 03
Cross-cluster setup by hand
In a single-cluster interface, replication can only be set up halfway. The rest is commands on the other cluster so the two can pair: slow, error-prone, and different every time.
- 04
Who changed what, where
Two identical clusters in two regions should perform the same. Finding out why they do not, and who changed what on which one, is guesswork without a side-by-side view and a cross-cluster audit trail.
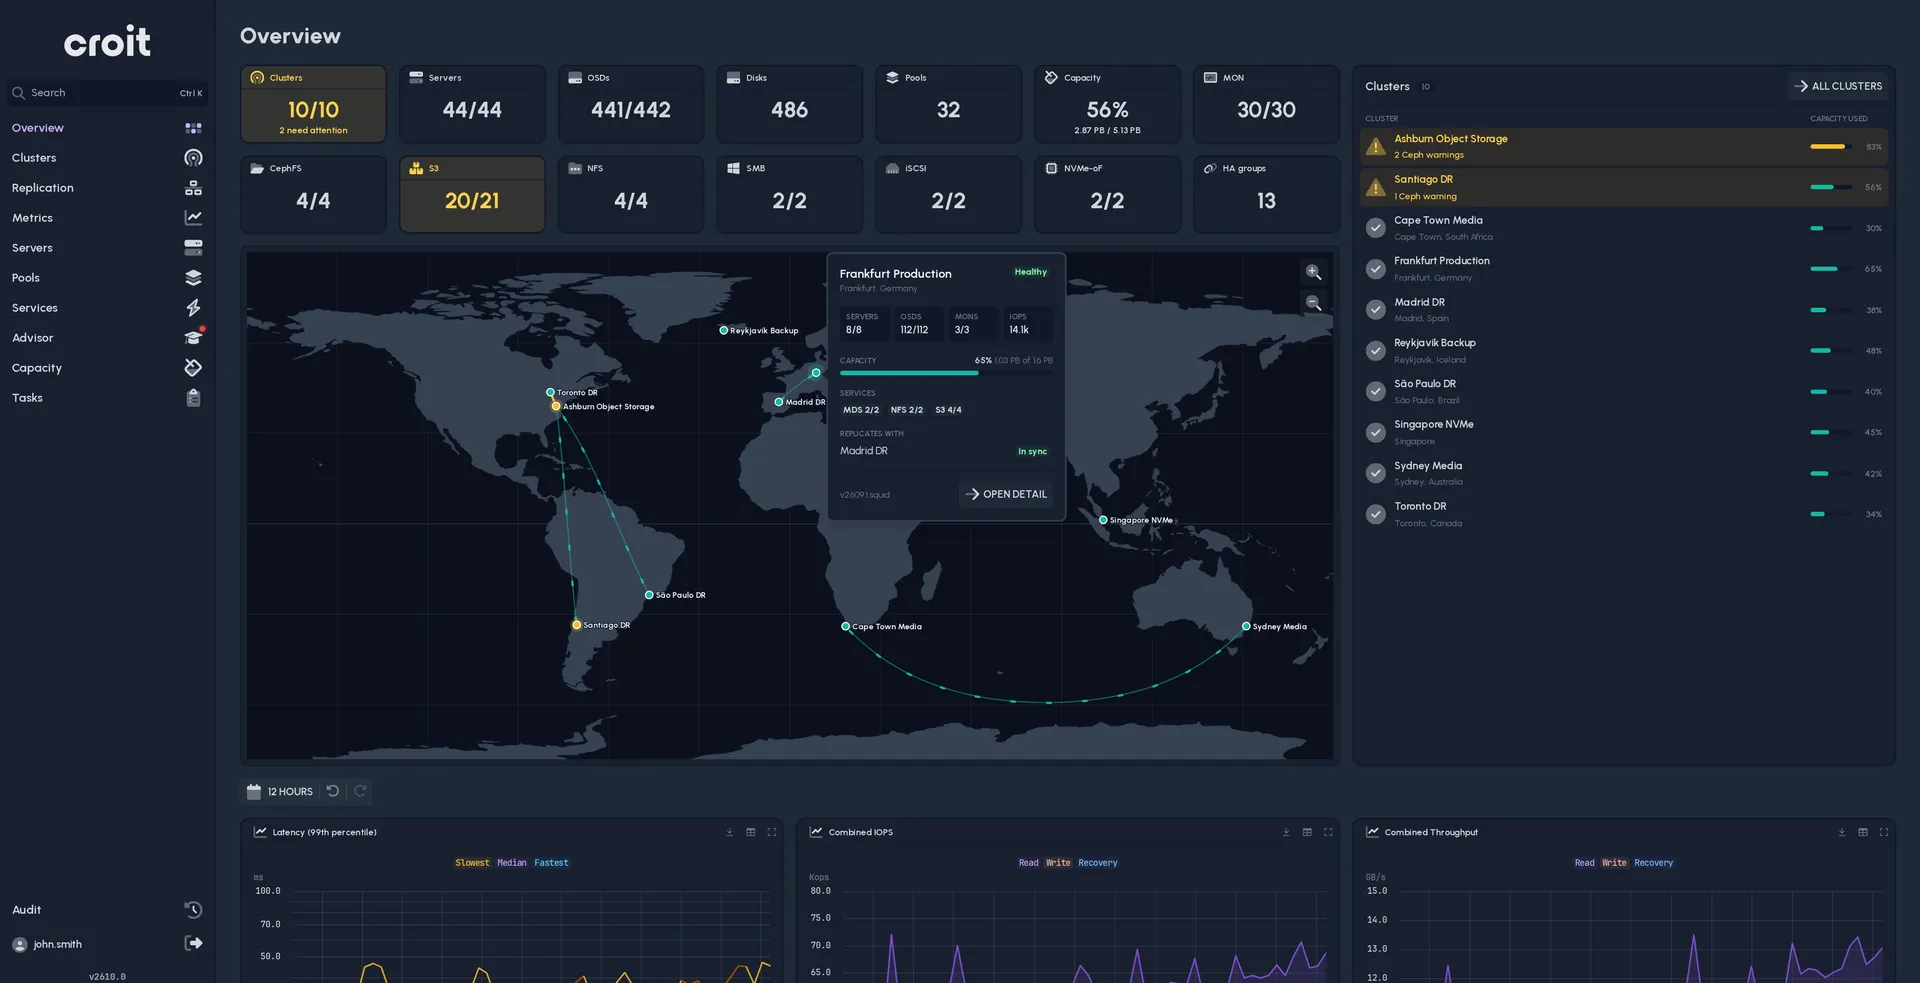
See everything
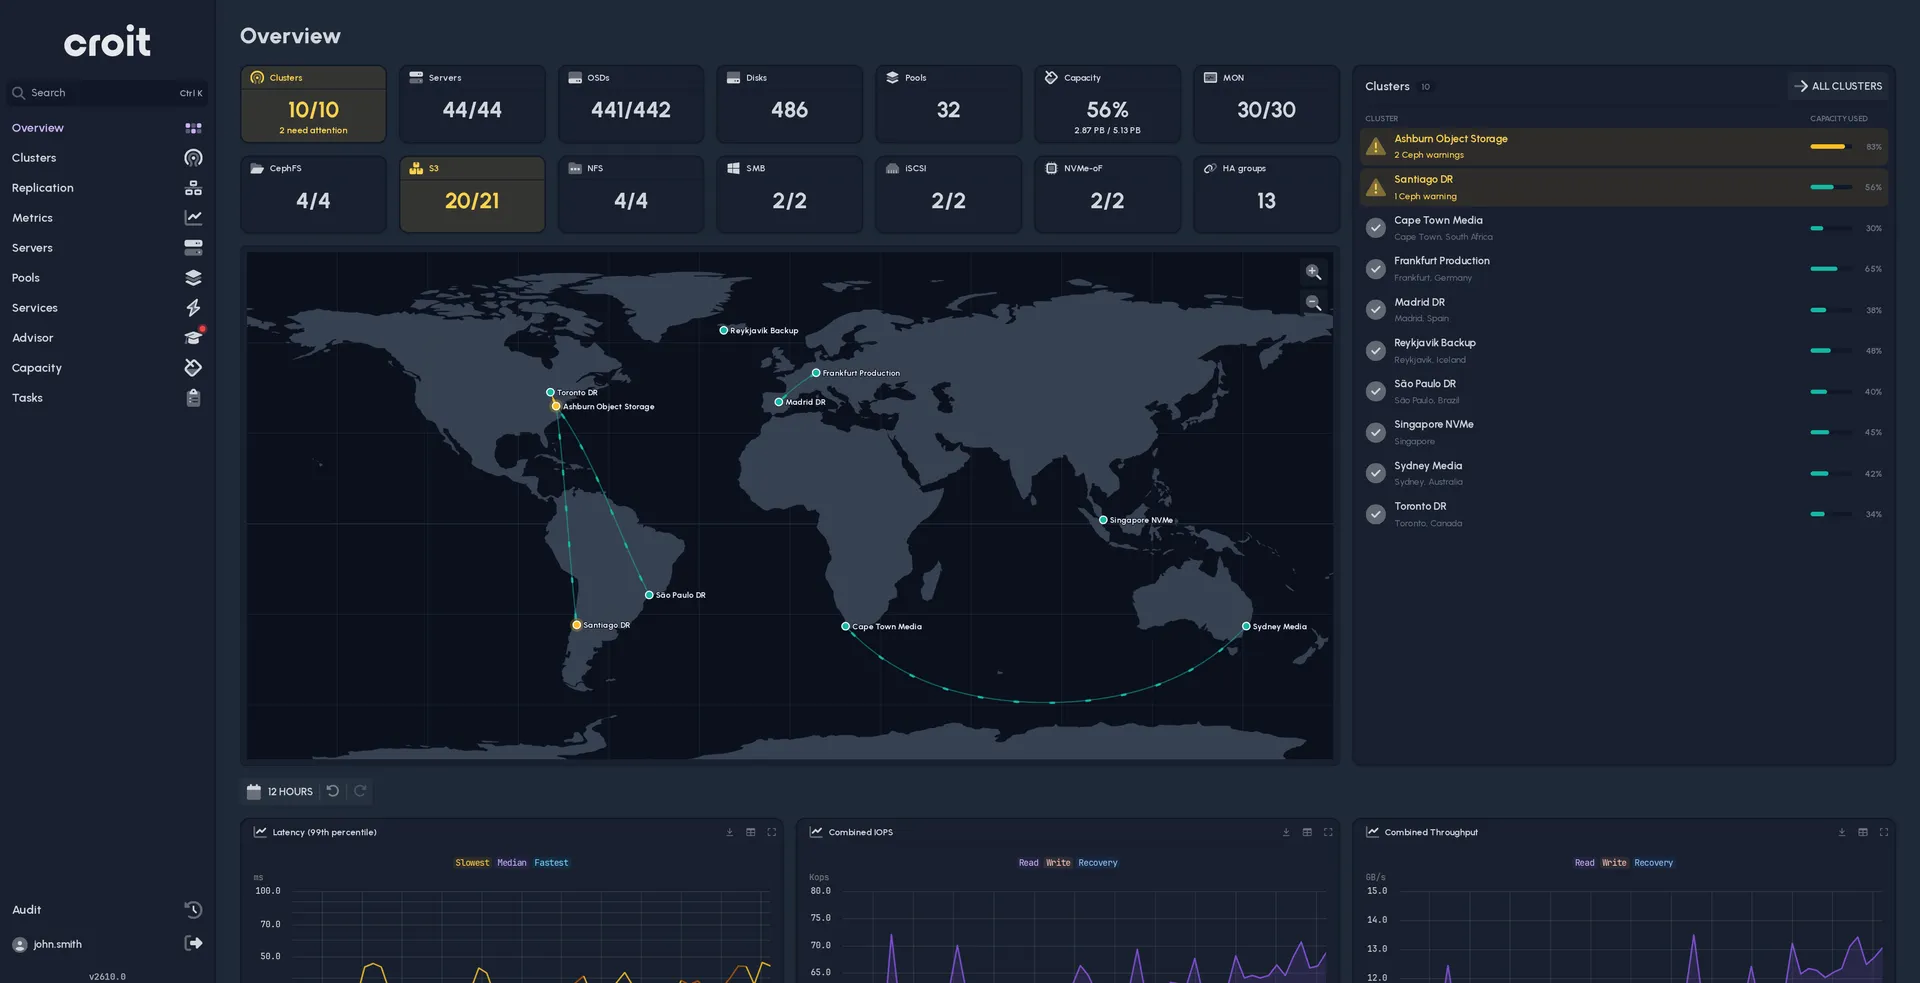
A world map with the status of every cluster, and underneath it the details that metrics leave out: logs, live logging, configuration, disk usage and SMART health, and the audit log.
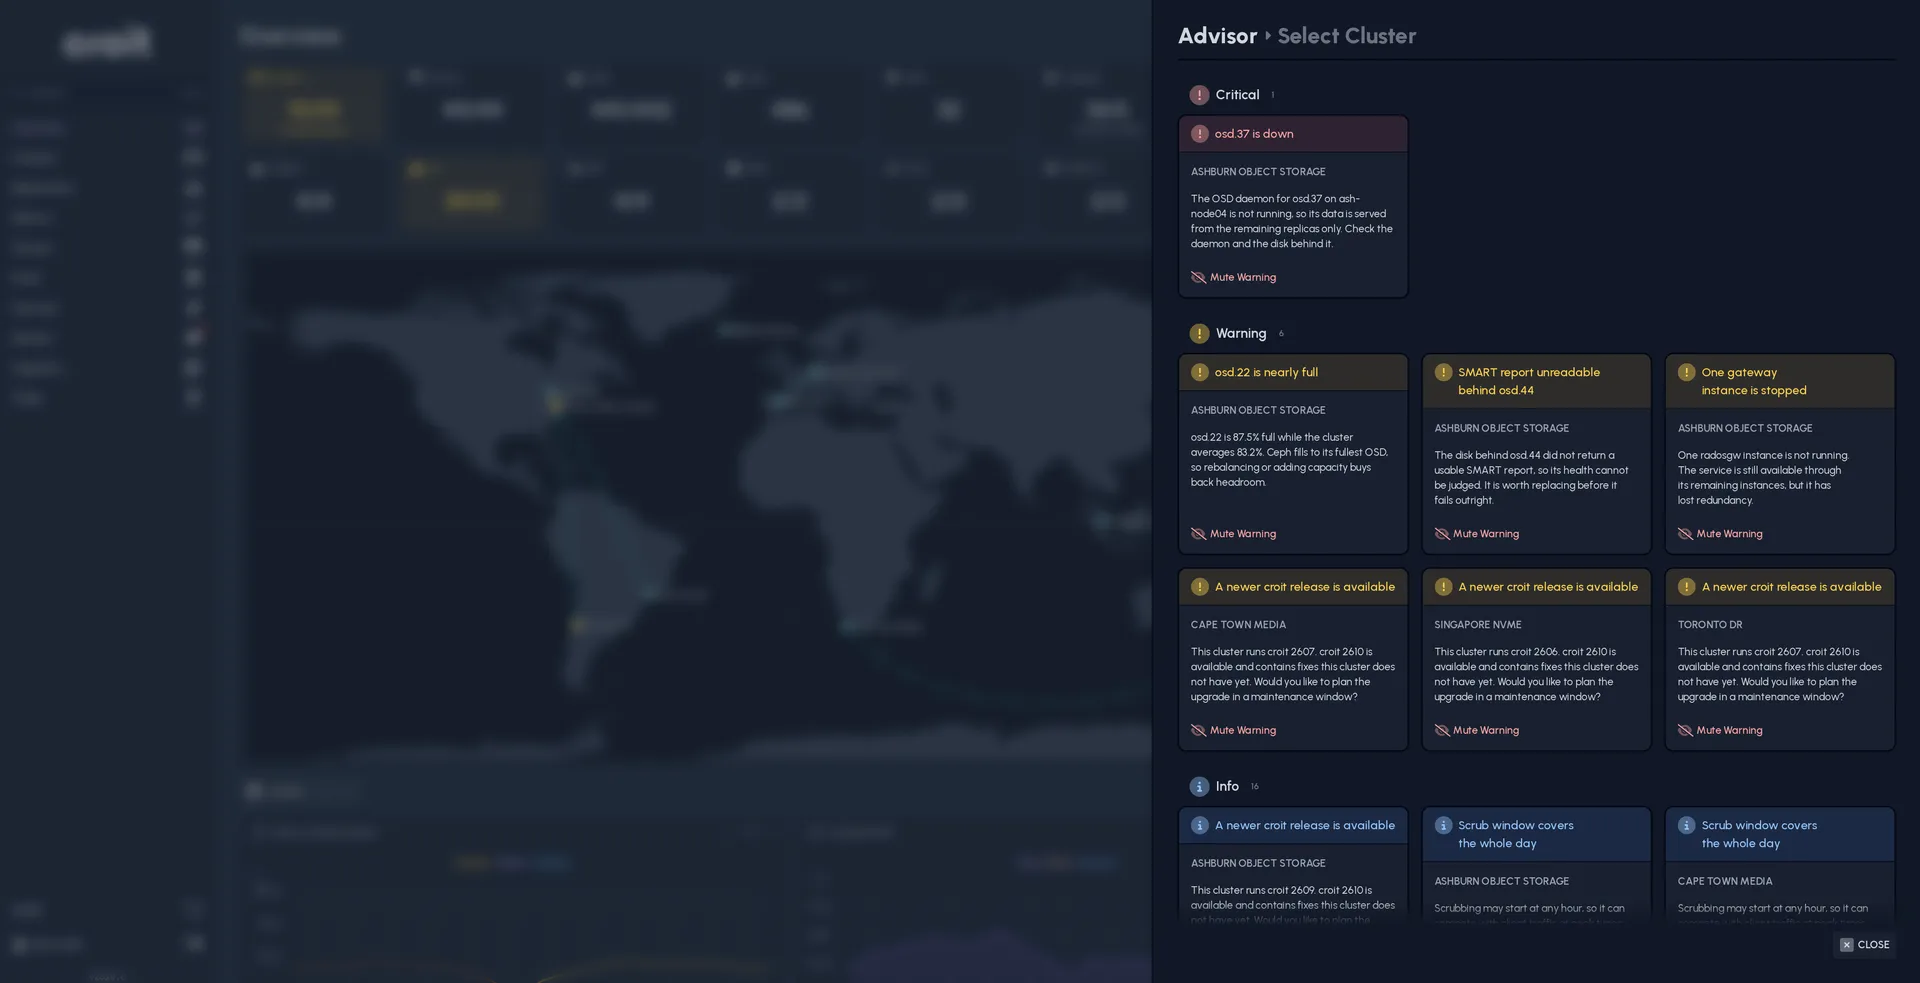
Act centrally
Not read-only. Updates and licences for every cluster from one place, configuration changes, support tickets opened where the problem is seen, and a one-click jump into any cluster's interface with the same credentials.
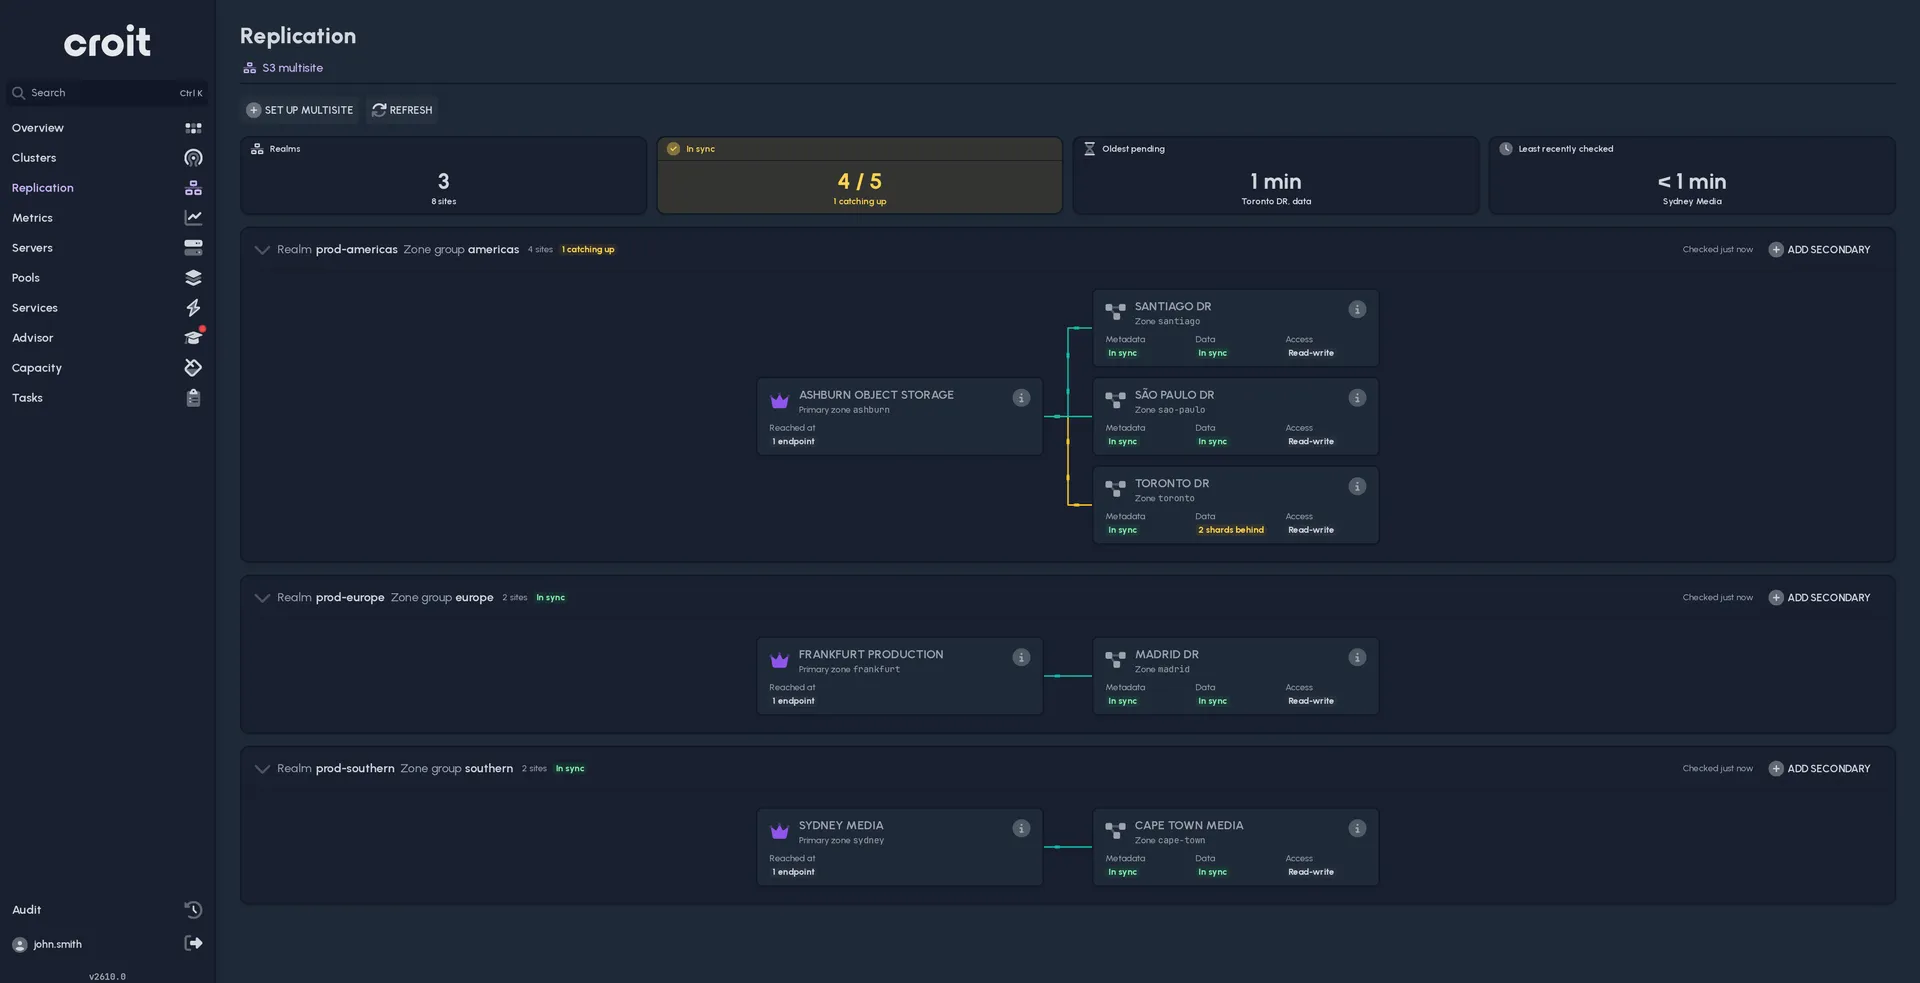
Connect clusters
Cross-cluster features deployed end to end: pick the clusters, choose S3 multisite, CephFS mirroring or RBD mirroring, and the dashboard rolls it out on every side and shows the data flows between the pins.
How it works
- 1
Start one container
The dashboard is a Docker container, started with one command and connected once to your OpenID Connect identity provider.
- 2
Add a cluster
Enter the address of a croit manager or a native Ceph cluster, authenticate once, and place its pin on the map. Add as many as you run, whenever you like.
- 3
Drill in
Click a pin for logs, disks and configuration. A button opens that cluster's own interface through a proxy with your credentials, so there is no second login.
- 4
Connect sites
Select two or more clusters and choose the replication. The dashboard configures zones, zone groups and bucket sync for S3 multisite, or sets up CephFS and RBD mirroring, on every side.
Two regions, side by side
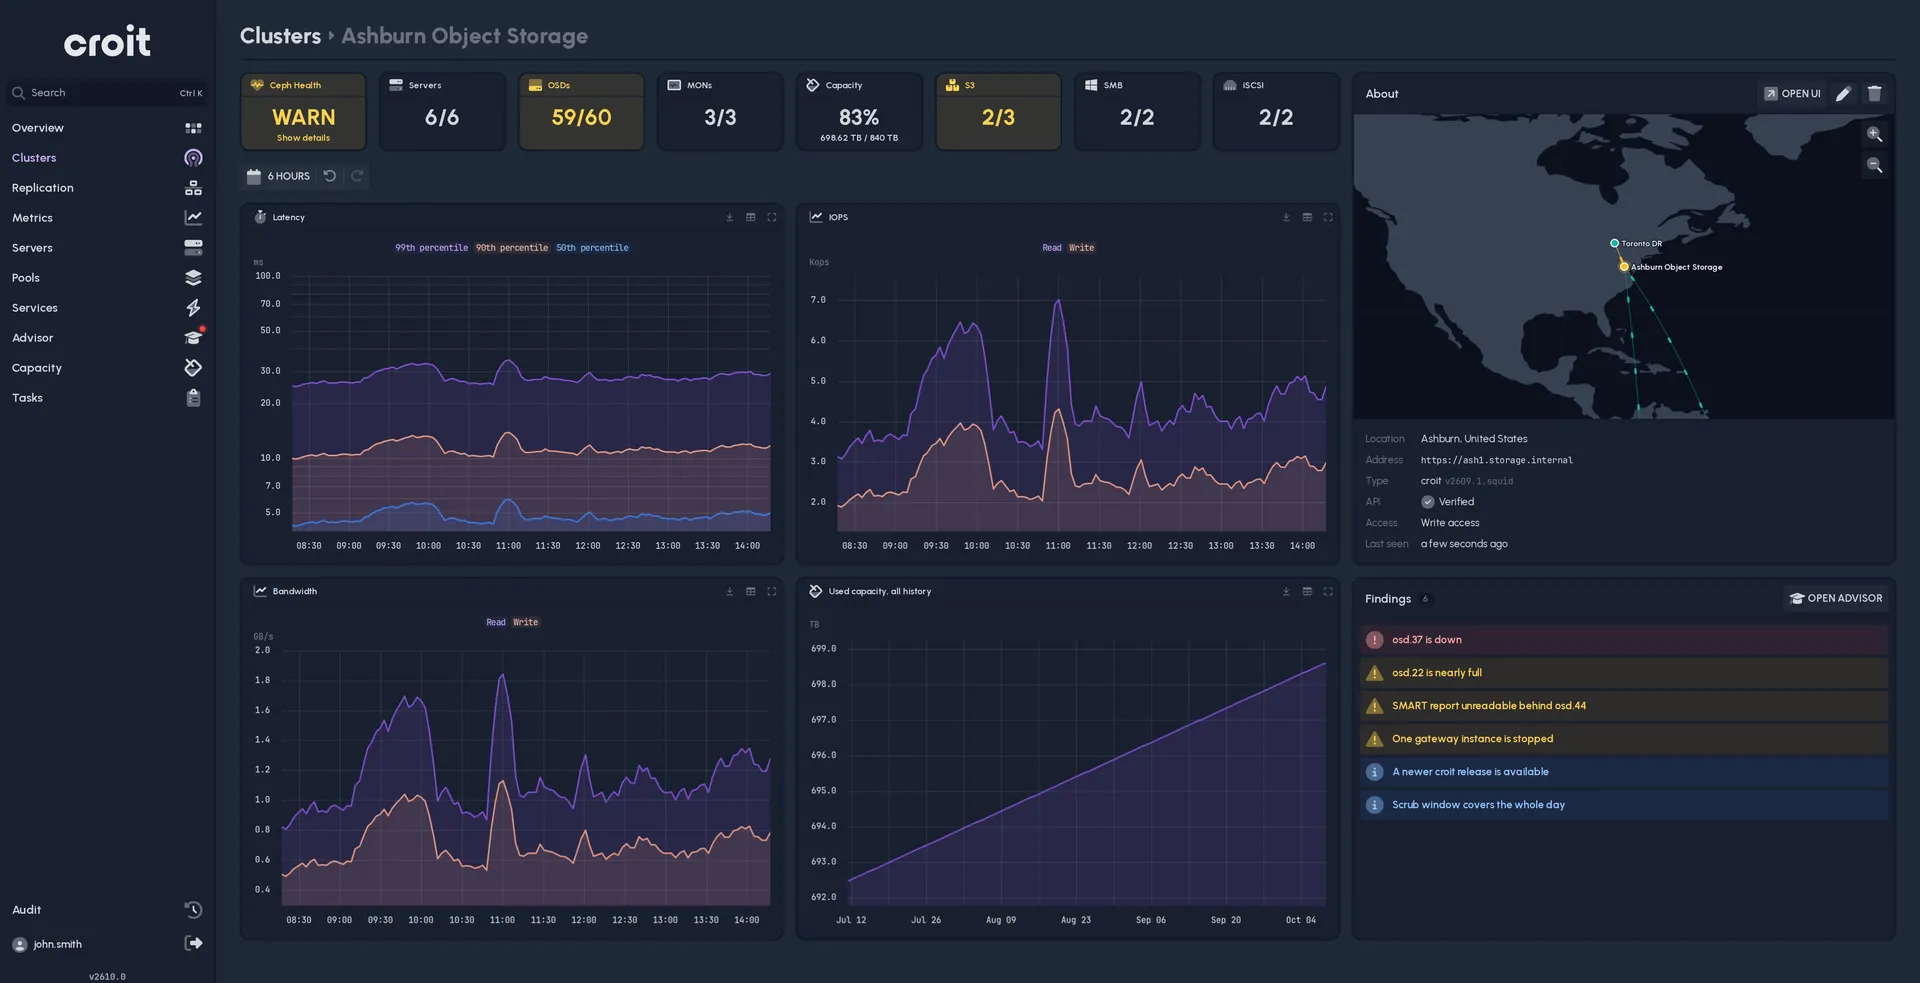
Frankfurt Production is healthy: 8 of 8 servers, 65% full, replicating with Madrid, and one note from the advisor that a newer release is out.
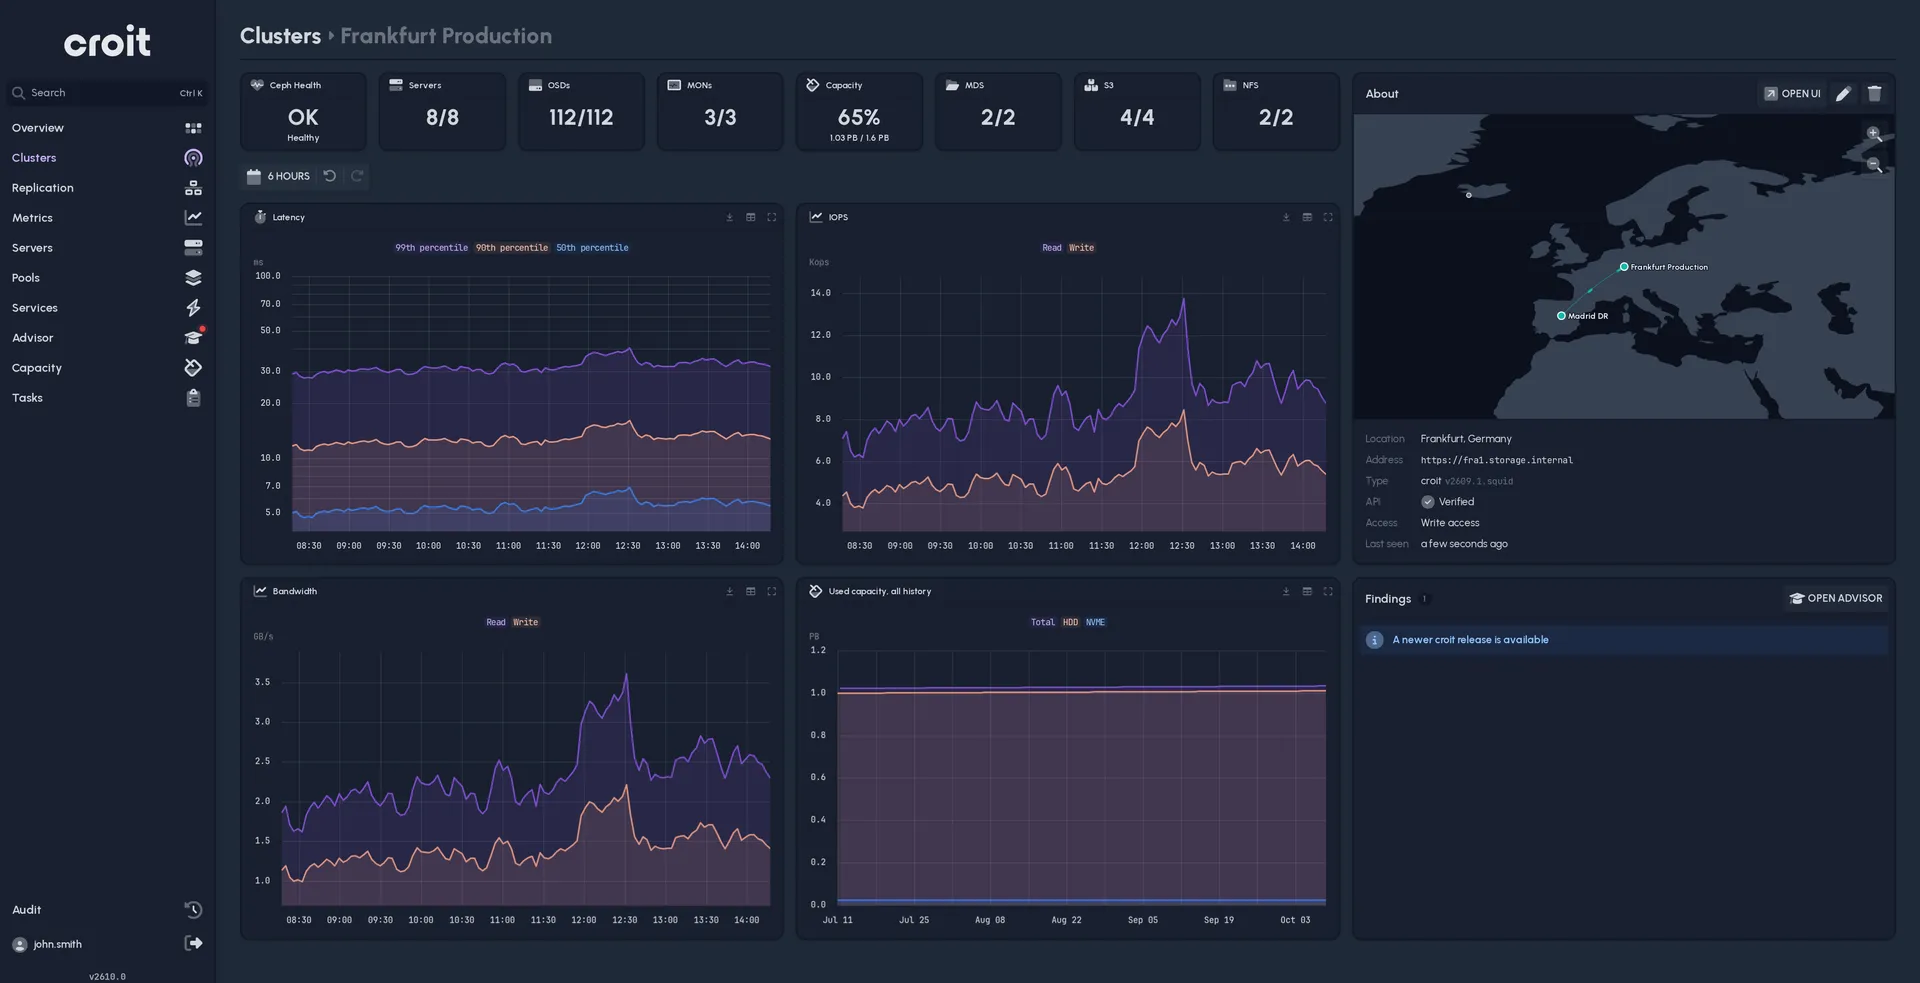
Ashburn Object Storage has a warning: one OSD down, 83% full, a gateway instance stopped. Six findings, each with what to do about it, before anyone opened a ticket.
What runs across clusters
S3 multisite
Geo-redundant S3
Zones, zone groups and bucket sync across locations, for redundancy or CDN-like delivery close to users. Configured visually, with the data flows shown on the map.
CephFS mirroring
File systems replicated over the WAN
croit's own parallel implementation of CephFS mirroring, built for replication between sites. Set up centrally for the clusters you pick.
RBD mirroring
Block devices in two clusters
Disaster recovery for virtual machines and databases: RBD images mirrored to a second site, configured from the dashboard rather than on each cluster.
Audit log
Who did what, on which cluster
On croit clusters every click and API call is recorded. The dashboard shows the audit trail of your whole estate in one place, for the day someone asks.
Capacity across the fleet
Know which cluster fills first
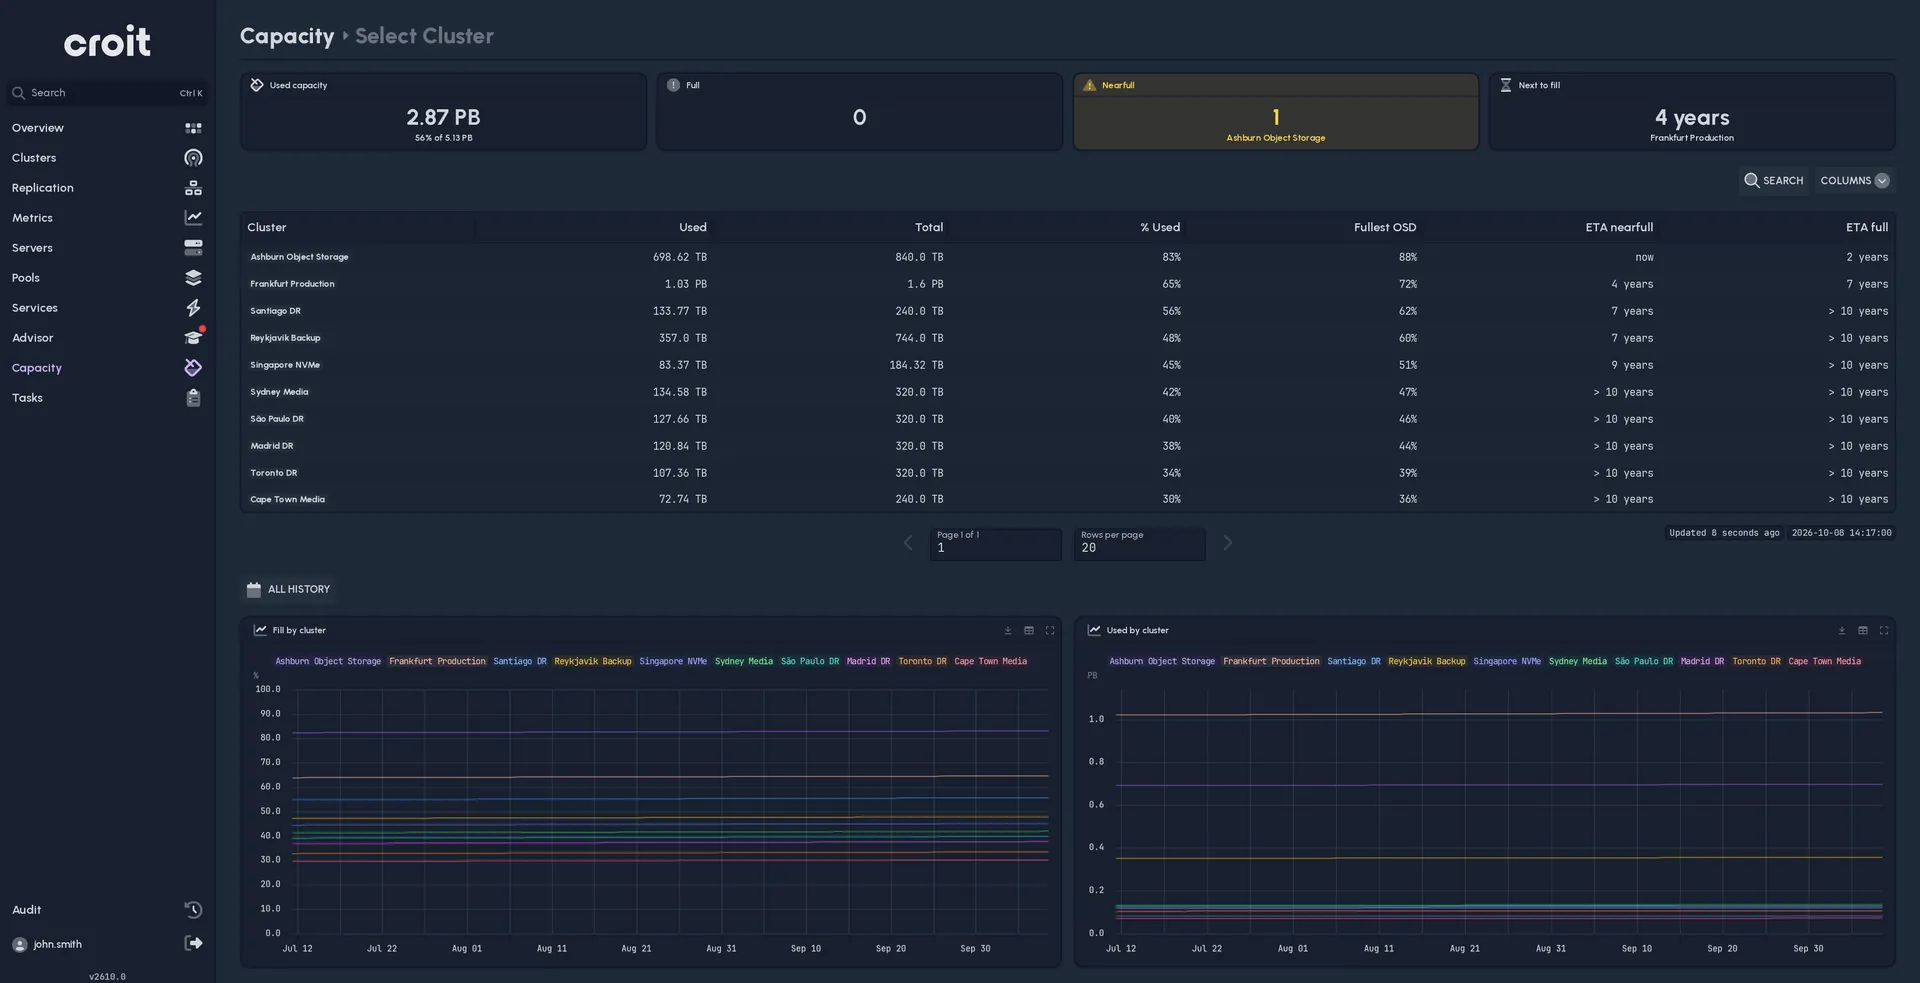
Used and total capacity for every cluster in one table, the fullest OSD on each, and an estimate of when it reaches nearfull and full. Ashburn needs attention now; Frankfurt has four years. Budget for the next servers before the pager does.
croit clusters and native Ceph
The dashboard manages croit clusters and native Ceph clusters alike. What it can do on each depends on the cluster type and version: croit clusters bring the audit log, central updates and the full detail view; a native Ceph cluster gets the map, the drill-down and the cross-cluster features it supports. Bringing an existing Ceph cluster into view is often the first step towards running it on croit.
See your clusters on one map
Tell us how many clusters you run and where, and we show you the dashboard on a setup like yours, with a quote for your number of clusters.
FAQs
Yes. Native Ceph clusters are added the same way as croit clusters: enter the address, authenticate once, place the pin. Feature depth depends on the cluster type and version; croit clusters add the audit log and central update and licence management.
No. It is a Docker container you run where you like, started with one command and connected to your own OpenID Connect identity provider. Nothing about your clusters leaves your environment.
No. It sits above them. For anything cluster-specific a button opens that cluster's own interface through a proxy with the same credentials, so there is no second login.
Grafana and Prometheus show metrics. The dashboard shows what you need once a metric looks wrong: logs, live logging, configuration, disk usage and SMART health, and it lets you act: updates, licences, tickets and configuration changes, from one place. Keep Grafana for the KPIs; the dashboard is for the next step.
From the second cluster on. With one cluster its own interface is enough. With two sites you already have replication to set up and two logins to juggle, and the dashboard earns its place at the first incident that spans both.
Ask us. Pricing depends on the number of clusters you connect; tell us how many you run and where, and you get a quote together with the demo.