
Documentation
- Getting Started Configuration Using CDM
- Clusters
- Fleet Configuration
- Capacity
- Metrics
- Servers, Pools and Services
- Logs
- Advisor
- Tasks and Audit
- S3 Multisite
- RBD Mirroring
- Support
Capacity
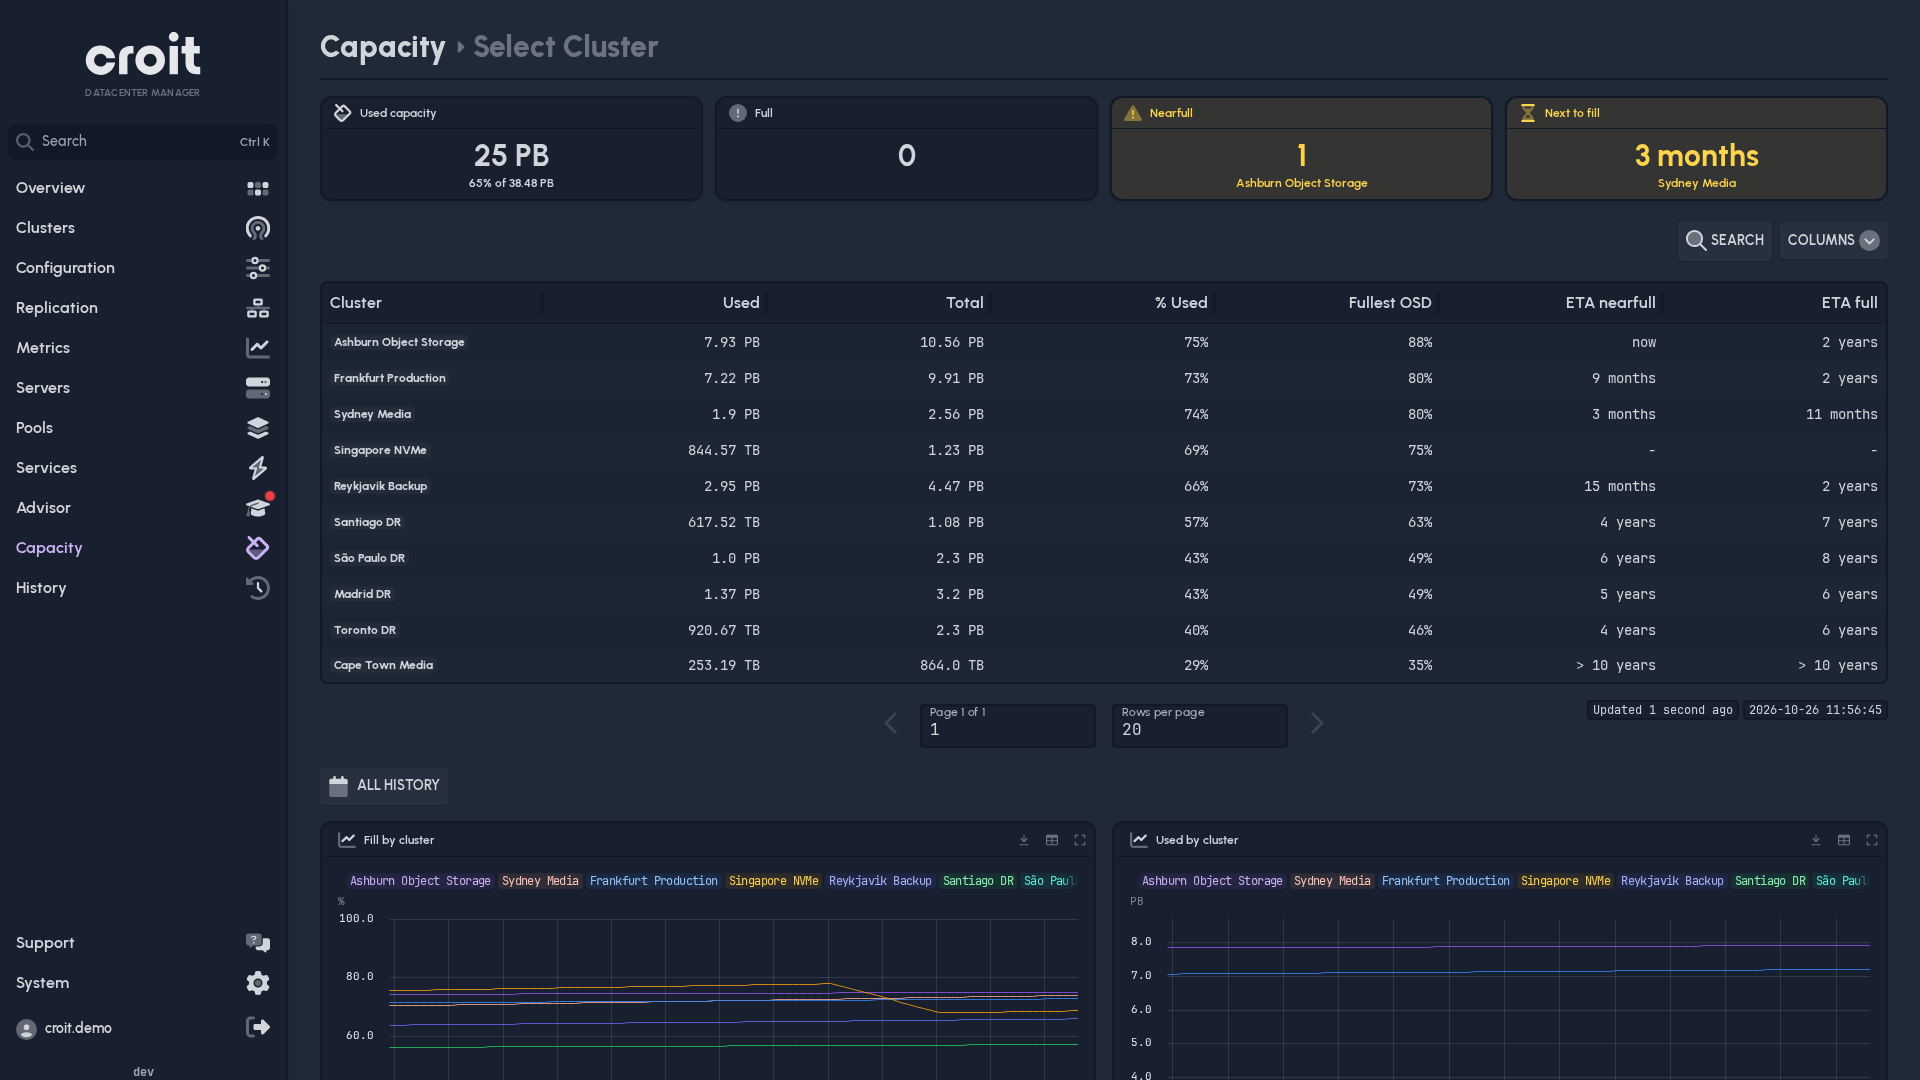
Ceph stops writes as soon as one OSD is full. CDM therefore rates each cluster by its fullest OSD. Full and Nearfull count the clusters whose fullest OSD reached the cluster's full or nearfull ratio.
Forecasts
The forecast projects recent growth onto the fullest OSD of each device class. Adding OSDs or rebalancing changes it.
A forecast needs some days of history. When you add a croit cluster, CDM imports its recent history, so the forecast is usually there right away. Plain Ceph clusters have no forecast.
Charts
Across the fleet, the charts show how full each cluster has been and how much it holds. In a large fleet they name the fullest clusters and add the median of all of them.
Pick a cluster to see each of its device classes on its own row. One chart shows the used raw space below the size the class had at the time, so added OSDs show as a step. The other shows how full the class is on average and how full its fullest OSD is, against the cluster's nearfull and full ratios. Ceph stops writing to a class once one of its OSDs is full, so the fullest OSD is the line to watch.